We’ve known for quite a while that global temperatures have been increasing since the Industrial Revolution. For the last century, we have been lucky enough to have an ever growing network of high quality of weather stations (click that link!), but before that we have had to use what we know about tree growth, lichen growth, and atmospheric concentrations of certain gases trapped in glacial ice (among other things) to reconstruct global temperatures. None of the methods (weather stations included) are without their flaws. Using tree rings, lichen growth or ice bubbles are often imprecise. This doesn’t mean they’re wrong (they’re not); just that it’s more suited to giving an approximate than a definite.
Even our collection of weather stations is an imperfect tool for global temperature analysis. There are areas with lots of weather stations and huge swaths of ocean (and Siberia!) where we have substantial gaps in coverage. Similarly, a disproportionate amount of weather stations are located in valley bottoms or near urban centers (coincidentally, climate skeptics often point to this to discredit climate change studies). Statistical methods have been developed for dealing with these problems, but the end product is that it contains an element of uncertainty (like all science), meaning we have to say something like “That pack of gum will cost somewhere between $1.02 and $1.06” instead of “That pack of gum costs $1.04”. To reduce this uncertainty, multiple independent lines of evidence are used to make predictions. If weather stations are telling us one story about global temperatures, and tree ring analysis is painting a similar picture, we have independent corroborating evidence that gives us more confidence in our conclusions. Today we have lots of corroborating evidence at low elevations, but somewhat less higher in the atmosphere. This is where glaciers come in.
One of coolest (absolutely no pun intended) things about glaciers, is that they act as ‘built in’ high altitude weather stations. Because their response to increased temperatures is relatively straightforward (temperatures increase, more ice melts), glacier retreat records can act as another independent line of evidence that also fills our ‘gap’ of high altitude (and latitude) observations of global temperatures.
Observations on the retreat and advance of glaciers are kept in the annals of the World Glacier Monitoring Service. There, glacier records are constructed from everything from 16th century paintings to repeat satellite measurements. From Oerlemans 2005:
The information on maximum stands from sketches, etches, paintings, and photographs can be checked with moraine systems that are still in place today.
For his 2005 study, Oerlemans obtained records on the length change of 169 glaciers, some starting as early as 1600. The dataset contained records from glaciers from both the arctic and tropics, from high and low altitudes. This collection of records show that between 1860-1900, most glaciers were retreating on average between 0-12 meters per year, while only one of the 36 glaciers with records extending back to 1860 advanced during this period. From 1900 to 1980, 142 of the 144 glaciers retreated, most averaging between 0 to 16 meters per year.
By combining all the glacier records, we can see that before 1800 the records indicate a glacier advance (usually referred to as the “Little Ice Age”). From the mid-1800s onwards, however, glaciers around the world have been retreating, with an accelerated rate since 1950.
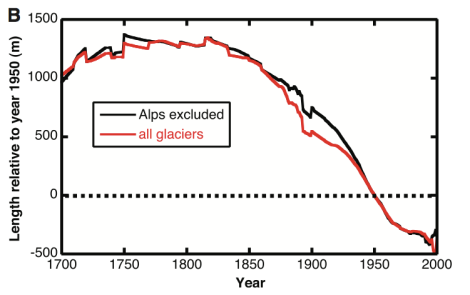
From Oerlemans 2005. Globally, there is a trend of glacier retreat since the early 1800s. The rate at which glaciers are retreating up-valley is greater from the mid 20th century to late 1980s.
This record indicates temperatures would have had to increase in order to cause the observed retreat. However, the relationship between glacier length and temperature is complicated by the fact that there is a lag between warmer temperatures and glacier retreat.
To better understand this concept, we need to think about how glaciers actually grow and shrink. Whether a glacier is growing or shrinking depends on the relationship between melt, and snowfall. If melting is greater than snowfall, the glacier will shrink, while a surplus of snow will grow the glacier. Since glaciers flow from the high alpine into valley bottoms, there are areas that grow, while other areas shrink. Since higher elevations are colder, the upper part of the glacier experiences less melt and gains mass, while lower elevations shrink. The elevation at which melt is equal to snow accumulation is referred to as the “Equilibrium Line Altitude” (or snow line at the end of the melt season), and is easy to spot in a continental glacier as the line where snow meets ice. Since the glacier is gaining ice above the Equilibrium Line Altitude, and losing it below, the net effect is that a bulge is forming at the top of the glacier. This ‘bulge’ doesn’t stick around though; instead it slowly begins to flow downhill.
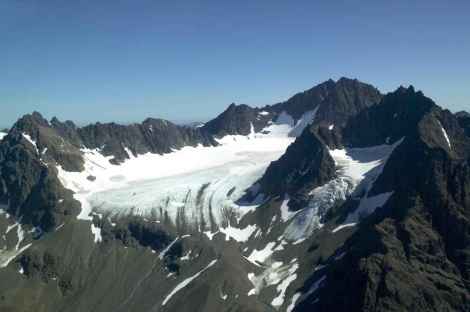
The Equilibrium Line Altitude (ELA) is clearly visible as the line between the dark ice and the bright snow. Above that line, the glacier is gaining mass, while below that altitude, it is losing mass. The balance between the two over many years will ultimately determine whether the glacier will advance or retreat. (picture taken from wikipedia commons – click the picture to be redirected)
The catch, however, is that glaciers flow relatively slowly. If we have a snowy cold year, and the glacier accumulates more snow than usual (the Equilibrium Line Altitude is lower), that ‘bulge’ doesn’t flow all the way to the bottom of the glacier in one year. In reality, it will take many years for the bottom of the glacier to advance from this snowy year. The time a change in melt or snowfall takes to have an effect on the glacier length is called the “Response Time”, and is unique for each glacier, and each region. Ultimately, a glacier’s response time is function of its slope (steeper glaciers flow faster) and glaciers with more snowfall (more snow means a heavier glacier, which will translate to faster flow or more ice ‘turnover’). A fast glacier may have a response time around 10 years, while a slow glacier could be upwards of 100 years.
Over decades and centuries, snowfall is relatively constant, which, combined with the fact that large variations are needed to trigger measurable change, means that melt is the main variable controlling glacier retreat. Melt itself is determined by sunlight, air temperatures, humidity and wind speeds (among other things), yet, over decades and centuries, it is essentially controlled by air temperatures.
When we add all this up, it means that the retreat or advance of a glacier is determined by air temperatures and the response rate of the particular glacier. This means that if we have records how glaciers have retreated, and we calculate their response times, then we can use glaciers as reliable thermometers to reconstruct historical temperatures.
If we do this, (as Oerlemans did – see below) it produces a global temperature trend similar to what we get from tree rings and other alternative methods. Reconstructing historical temperatures from glacier retreat gives us another independent, corroborating line of evidence to the trend and magnitude of current global warming.
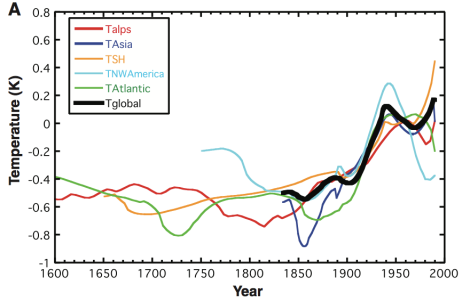
From Oerlemans 2005. Using glacier retreat records, continental, and global average temperatures relative to 1950 were reconstructed. It shows a relatively consistent heating between continents since the Industrial Revolution.
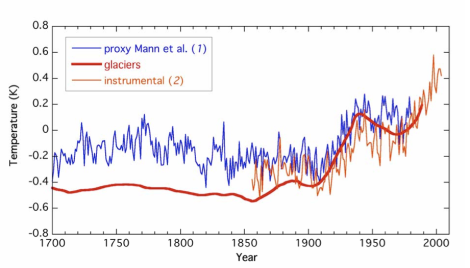
From Oerlemans 2005 Supporting Materials. Three lines of independent, corroborating evidence on the magnitude of current climate warming: “Glacier Retreat Temperatures” are plotted next to our instrumental (weather station) records, as well as the famous “Hockey Stick” paper (Mann et al.) which used tree ring analysis (among other things).
Further Reading:
If you want to take a look at the full Science paper (which may be shorter than this blog entry!):
Oerlemans, Johannes. “Extracting a climate signal from 169 glacier records.” Science 308.5722 (2005): 675-677. (link)
“From a Glacier’s Perspective” is a really cool blog too. In particular, this post about glacier retreat is something you could easily get lost in for hours.

It is worth noting that the most sensitive measure of climate recorded by the glacier is its mass balance. Determined annually this is the difference between accumulation and melting. A negative mass balance indicates volume loss, positive mass balance volume gain. Since 1980 mass balance has become more negative which has increased retreat, in fact we now have 21 straight years of loss. The glacier business would be bankrupt if they did not have so much income stocked away in their frozen banks. Each year I right the chapter on glacier change for that year in BAMS State of the Climate, note 2011 details
Agreed. The only problem with mass balance studies is that they’re intensive, and by that I mean we have less records, and have to rely more on them being ‘representative’. Length records, on the other hand, are easily available, you can pull them off satellite records, or even old photos. Mass balance won’t ever be replaced, but it’s nice to have another line of evidence!
Pingback: Muddying the Waters – Calving Glaciers and their Response to Climate | Matt Chernos·
Pingback: Bridge Glacier and the Life-Cycle of a Calving Glacier | Matt Chernos·
Pingback: GlacierChange.org·
Pingback: What’s going on at Bridge Glacier? – Time-Lapse Photography | Matt Chernos·