If you live in Calgary, you’ve likely already read about Leonardo DiCaprio’s comments, but in case you haven’t, here it is:
“We were in Calgary and the locals were saying, ‘This has never happened in our province ever.’ We would come and there would be eight feet of snow, and then all of a sudden a warm gust of wind would come. It was scary. I’ve never experienced something so firsthand that was so dramatic. You see the fragility of nature and how easily things can be completely transformed with just a few degrees difference. It’s terrifying, and it’s what people are talking about all over the world. And it’s simply just going to get worse.”
Now, if you live in Calgary (or have family that gloats!), you’ll recognize that he’s describing a Chinook, in particular, one from last year (2014) that made for January patio weather (it was awesome).
You can probably imagine that Calgary, the NDP-voting, carbon taxing socialist haven, was not super-thrilled by his comments (under no circumstances should you read that article’s comments section). Predictably, things got smug pretty quick, and descended into, well…

The Calgary Sun: the heart of Alberta socialism
Chinooks aren’t anything new to Calgary. Warm mid-winter winds almost certainly swept down the plains and melted all our snow long before we were burning coal. Southern Alberta even has a bunch of folklore centred around the Chinook, from Johnny Chinook (you should watch this) to, well, this:
A man rode his horse to church, only to find just the steeple sticking out of the snow. So, he tied his horse to the steeple with the other horses, and went down the snow tunnel to attend services. When everybody emerged from the church, they found a Chinook had melted all of the snow, and their horses were now all dangling from the church steeple. (from Wikipedia)
Although they’ve been happening for a long time, this doesn’t necessarily mean they don’t have anything to do with climate change. Instead of wasting time ridiculing an outsider, why not make something productive out his (simplistic) comments, and ask: “is it possible that there are more Chinooks now than before?”
The Data:
To test this, I grabbed Environment Canada daily weather data from Calgary Int’l A for the period 1907 — 2012, using my sweet little web-scraper.
From my breakfast research, I couldn’t find any climate studies that had quantitative ways to define Chinooks, but there were a few health studies (1), (2) that had some rough guidelines to follow. In the end, I ended up defining a Chinook as any event:
- That occurs between November and March
- Where the daily maximum temperature was greater than 5 C
- And the daily maximum temperature was 5 C greater than the day before.
I then counted the number of occurrences for each year.
Are there more Chinooks now than before?
Yes. Turns out that from 1907 to 1960, there was a slight decrease in the number of Chinook days, but generally multi-year averages showed about 10 to 12 days a year. From 1960 on; however, there is a significant and steady increase in the number of Chinook days, rising from an average of 10 up to almost 15 days per year. The regression line from 1960 to 2012 was significant at >99% (science is really, really sure the line is a real signal, and not random variations), and projects about a doubling of number of Chinook days every 100 years.
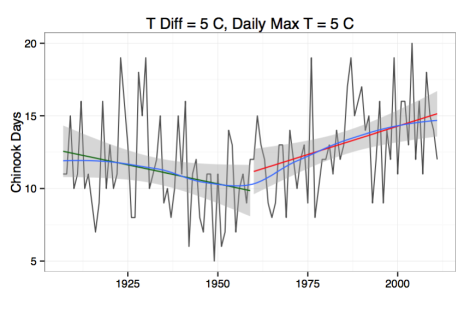
Blue line is a loess smoothed trendline, while the green and red lines are pre and post 1960 trends. The shaded area is a 95% confidence interval.
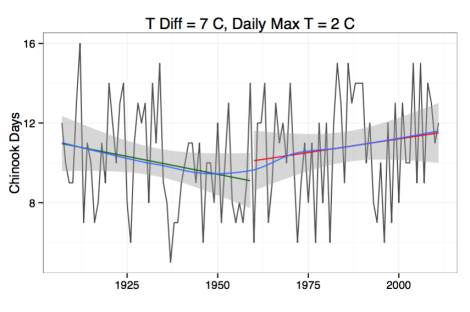
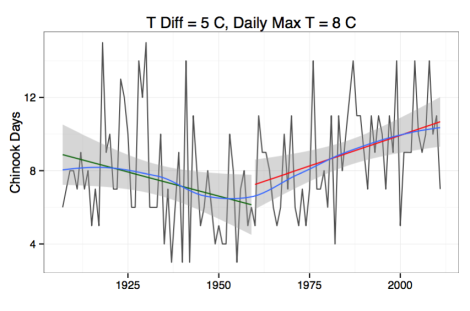
One weakness in this analysis is that the assumptions of defining a Chinook are hardly definitive, and could have impacted the results. To check this, I re-did the same analysis, using two other scenarios (max temperature of 2C and temperature difference of 7C, and max temperature of 8C and temperature difference of 5C). Both scenarios show pretty much the same thing as the “5 and 5” assumption above: the number of Chinooks decreased until 1960, but have increased since then. Additionally, however you slice it, there are more Chinook days now than before.
Why would this happen and what does it have to do with climate change?
To think about why this would happen (and what it could have to do with climate change), it helps to think about how and why a Chinook happens. Chinooks (also called Foehn) winds (which are not unique to southern Alberta) occur when wet gets carried eastward off the Pacific Ocean. The air, heavy with water vapour, gets pushed up the westward side of the Rocky Mountains and cools. As it cools, the water vapour condenses into rain droplets. When water vapour condenses to liquid, it releases a bunch of energy to the air, which turns into heat. By the time the airmass has reached the eastern edge of the Rockies, all the water has fallen out of the air (as rain/snow), but all the heat from condensation remains. Then, as the air descends over Calgary, it graces us with abnormally warm temperatures, and lots of dry (dry!) wind, eating all 8 ft of snow and granting us hours of patio weather in December.
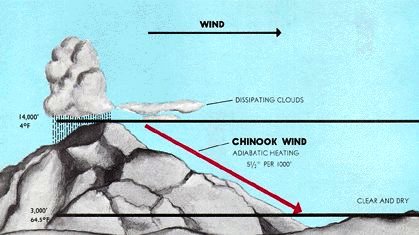
Taken from Wikipedia Commons.
Given that we in Calgary bask in sun while those suckers in Vancouver get pounded with a Pineapple Express, we can make the connection between coastal weather and Chinooks. Sea surface temperatures are increasing (more water evaporates to atmosphere, more severe storms), while surface and air temperatures are as well (hotter air holds more moisture). Given that, it doesn’t feel like much of a stretch to suggest that the increase in Chinooks is likely due to an increase in We(s)t Coast storms intensity and frequency, and is therefore also one more bullet point in the long list of observed recent climatic changes.
Post Script and Update:
One point that has been brought to my attention by Leonora King, who is a PhD student at UBC Geography (yes, we get PhD advice here!) was that the trend analysis could be a little more robust. To do this, I’ve gone back and used the Mann-Kendall test, which is a nice tool of choice for trend analysis in environmental data. I applied the test over the whole period (1907-2012), and by gradually removing oldest decades (i.e. 1920 – 2012, 1930 – 2012, 1940 – 2012, … 1990 – 2012; it starts to get a little sketchy to use data with a length less than 20 years for this type of thing…).
Without getting too esoteric, the results from these tests show that pretty much no matter how you cut the time-periods, there is a (statistically, >99% confidence before 1980, >90% confidence since then) positive increase in the number of Chinooks per year. In fact, while I used 1960 as the cut-off point in the above analysis, the rate of increase in annual Chinooks is actually greatest from 1940 onwards, where we can expect three times as many Chinooks by 2040 as we did in 1940.
Data and R code is uploaded to my GitHub, so you can play with the trends and tell me how (statistically) significant I am.

It is an interesting article. However, there are a couple of things that you may want to look into before making statements about weather-related trends: non-climatic influences and large scale climatic influences. A hundred year old temperature record is bound to be affected by non climatic influences, such as instrumentation change, station relocation, etc. For more info see Trewin 2010 (http://www.stat.washington.edu/peter/593/Trewin.pdf). Using Weather Canada homogenized dataset (http://www.ec.gc.ca/dccha-ahccd/) may be a safer bet, although it is not perfect either. As for the large scale climatic oscillations, presented chinook patterns look suspiciously like a PDO cycle, you may consider accounting for that.
Hi Yulia,
Thanks for the thoughtful comments, and thanks for reading!
Regarding the quality of the weather data: It’s certainly possible that there has been some non-climatic influences, such as a change in sensors, and sensor drift, urban island, etc etc (all things that the Trewin 2010 paper describes much better than I could), the good folks at Environment Canada do deserve some credit for checking historical data (which you can read about here). Pragmatically, it’s also the ‘best-available-data’, given that monthly homogenized data won’t cut it to identify 24-48 events. While it’s certainly still possible there is some drift in the data, for our purposes, I don’t really think it has much of an impact on our conclusions. The trend in the Chinook data is quite strong, while the magnitude of shift to be classified as a Chinook is large, and is relatively insensitive to changing its specific definition. This tells me that even if there is some noise and/or bias in our Calgary weather record, it’s unlikely to be large enough to have shaped our conclusions.
Regarding PDO: The Pacific Decadal Oscillation is certainly has a similar trend to our Chinook trend (I’d bet it’s quite correlated). However, I’m not sure it would be productive to correct our dataset for the PDO signal. It makes sense that the positive phase PDO, which brings warmer sea surface temperatures, and more moisture to the pacific, would also drive more Chinooks, given the discussion above. It’s certainly up for debate (I don’t think I’d claim any blog post is a definitive source for science!) whether the PDO signal is fully responsible for Chinooks, and/or how these play into climate change, but the increase in the number of Chinooks at Calgary has been increasing since 1940 (when PDO was in a positive phase).
PDO was in a negative phase from mid 1940s to mid 1970s, however, there was a several years’ positive blip in the 1960s, which is reflected in your graphs. However the number of chinooks seemed to have come down after that blip, especially in the middle graph, before going back up in the 1980s positive phase.
Nice piece of work (what a glorious time we live in to have such data & tools available at our fingertips).

A glance at a graph of the PDO at Wikipedia implies that the PDO has entered a negative phase for the last decade, with pretty much the same pattern now (1998-2014) as 55 years ago (1943-1955). So if the PDO is the predominant driver of a change in Chinooks, we should we observing a decrease in numbers of Chinooks, not a continuing increase. It seems likely there is an additive effect between global warming and the PDO,….
Interesting study. I hunted it down because a friend did not recall any chinooks in 2018/19. It is elusive data because not all warm weather is a chinook and not all chinooks affect Calgary. His question was “could the modified polar vortex cause the end of our chinooks?” Your data suggests the trend is upward but his question is still valid. It might be deflecting our chinook winds to the south. Climate science is very complex so climate change predictions are mostly educated guesses. i asked a climate expert about our future without any control measures and he said imagine Calgary looking like medicine hat. Hot and dry. Newer models suggest warmer and wetter are possible. The polar vortex might make our winters extremely cold. No one is sure.